A3G – AUTOMATED ANDERSEN CASCADE IMPACTOR
A3G CONFIGURATIONS
-
pMDI CONFIGURATION
-
NASAL CONFIGURATION
-
DPI CONFIGURATION
-
DUSA CONFIGURATION
Cascade Impactors
There are several cascade impactors available on the market for measuring particle size distribution from inhaled drugs or an air sample. Most popular are the Andersen Cascade Impactor (ACI) and the Next Generation Impactor (NGI).
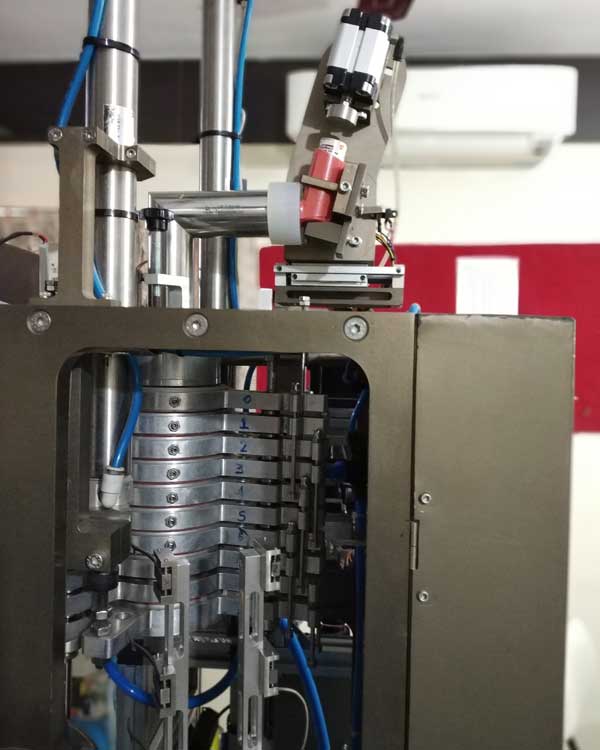
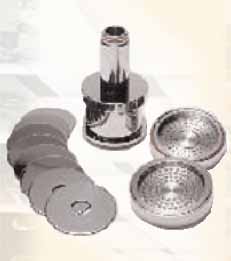
Andersen Cascade Impactor (ACI)
The manual ACI process greatly suffers from low productivity, typically two to four dose determinations per day and from operator induced data variability. Hence it takes years to generate the data and get regulatory approval from the FDA.
After drug injection, the 22 components of the ACI must be disassembled in a clean room, and each of its components washed, weighed, dried and samples are collected in duplicate from each disc and HPLC technique is used to determine the drug content. Assuming mass balance, the particle size is deduced from the layer it was collected and the particle size distribution for the dose is drawn up. The data from each process step has to be accurately recorded. Thus the process is slow there are many opportunities for errors when this process is manually executed.In order to understand the limitations of the technologies, we need to understand the technologies.
The Next Generation Impactor or the NGI
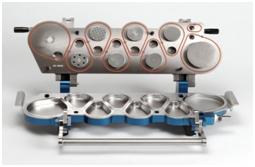
The picture shows the Next Generation Impactor. To increase productivity the number of individual parts has been reduced considerably. All of the cups shown in the bottom of the picture are integrated into a tray thus the operator has to handle a tray at a time. However the scope for automation is limited to solvent dispensing and sample collection. The washing is still all manual. The air passages are integrated into the body of the impactor (visible as large holes in the picture). They are difficult to clean and lead to drug accumulation and cross-over data errors. Further, the flight path of the aerosol particle is twice as long as in the ACI. This long path leads to droplet evaporation in case of the pMDI, and the errors tend to be biased towards fine particle fraction. To prevent droplet evaporation, scientists have to freeze/cool the NGI prior to use, making its productivity lower than claimed and the process expensive.